Television
TV viewing reaches 12-month high in January 2026, Nielsen reports
Nielsen Gauge shows cable surges 9 per cent, streaming holds 47 per cent share amid sports and drama boosts.
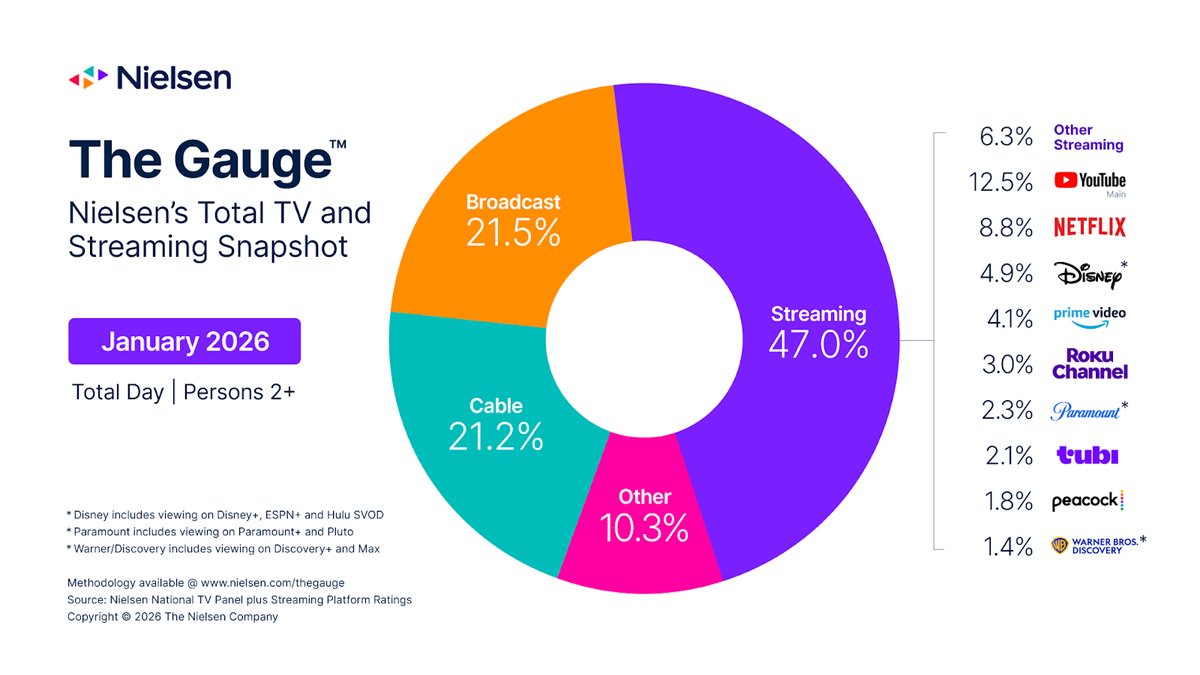
MUMBAI: When winter chills hit and big games kick off, viewers didn’t just stay in, they stayed glued. Nielsen’s latest Gauge report shows total TV and streaming consumption climbed to a 12-month peak in January 2026, up 3.7 per cent from December, driven by a potent mix of high-stakes sports, returning broadcast dramas and colder weather keeping people indoors.
Cable led the charge with the biggest monthly jump, capturing 21.2 per cent of total TV usage (up 1.0 percentage point). Cable sports viewing exploded 49 per cent over December, fuelled by ESPN’s coverage of the College Football Playoffs quarterfinals, semifinals and championship, included sending ESPN’s viewing soaring 82 per cent. Cable news also rode an active news cycle, rising 13 per cent, with Fox News Channel up 17 per cent and CNN jumping 29 per cent. Together, ESPN and FOX News each claimed 2.2 per cent of total TV usage, accounting for 21 per cent of January’s cable viewing.
Broadcast held strong at 21.5 per cent of TV (up 4.2 per cent month-on-month), anchored by NFL dominance, the top 15 broadcast telecasts were all football games, giving sports 30 per cent of the category. Dramas bounced back 24 per cent, with ABC’s High Potential emerging as the month’s most-watched drama. Broadcast news gained 10 per cent, led by ABC World News Tonight.

Streaming proved its staying power after December’s record highs, growing 2.7 per cent month-on-month and commanding 47.0 per cent of total TV usage. Netflix mirrored the category’s resilience with a steady 1 per cent increase to 8.8 per cent of TV, holding the top streaming programme for a second month as Stranger Things racked up 15.4 billion viewing minutes. Peacock jumped 10 per cent to 1.8 per cent of TV, boosted by the new season of The Traitors and NFL simulcasts on NBC most noticeably on 18 January during the L.A. Rams vs Chicago Bears Divisional Playoff, which drove a 78 per cent spike over its monthly average.
Free ad-supported platforms kept pace, Tubi rose 6 per cent to 2.1 per cent of TV, while The Roku Channel gained 5 per cent to hold its platform-high 3.0 per cent share for a second straight month.
The January data covers four weeks from 29 December 2025 to 25 January 2026, following Nielsen’s Monday-start broadcast calendar. In a media landscape where every screen fights for eyes, January proved that when sports roar and dramas return, the living room still wins, even if the remote is within arm’s reach of the streaming button.


Sports
IPL 19 TV Ad Volumes Rise 10 per cent Despite Fewer Brands
Google storms top spot as e-com services and mouth fresheners lead charge in four-match clash with IPL 18.

MUMBAI: Google has bowled a perfect googly in the IPL 19 ad arena while the batsmen chased sixes on the field, the search giant has quietly smashed the biggest boundary of all, claiming 12.67 per cent of commercial airtime and leaving rivals gasping. Overall television ad volumes for the four live matches of IPL 19 hit an indexed 109.94 compared with IPL 18’s baseline of 100, a crisp 9.94 per cent jump that proves advertisers still see cricket’s biggest stage as the ultimate pitch. Yet the numbers tell a more nuanced tale. Categories slimmed from 47 to 40 (a 14.9 per cent drop) and advertisers shrank from 58 to 43 (down 25.9 per cent), suggesting a leaner, meaner battle where the survivors are spending smarter.
The new pecking order makes for fascinating reading. In IPL 19, Ecom-Other Services surged to the summit with 13.78 per cent share, nudging out perennial favourite Mouth Fresheners (13.57 per cent). Air Conditioners (5.94 per cent), Corporate-Financial Institutes (5.69 per cent) and Paints (5.23 per cent) rounded out the top five, elbowing aside last season’s heavy hitters. Back in IPL 18, Mouth Fresheners led at 10.73 per cent, followed by Ecom-Gaming (10.62 per cent), Cellular Phones-Smart Phones (7.83 per cent), Biscuits (7.66 per cent) and Cars (6.60 per cent).
On the advertiser leaderboard, Google’s 12.67 per cent dominance is unassailable. Reliance Consumer Products (7.28 per cent) took silver, Havells India (5.94 per cent) bronze, while Vishnu Packaging (5.56 per cent) and K P Pan Foods (4.80 per cent) completed the top five. Contrast that with IPL 18, where Parle Biscuits (7.66 per cent) topped the chart, followed by Vishnu Packaging (5.92 per cent), Apple Computer India (5.52 per cent), Reliance Consumer Products (5.31 per cent) and Billion Brains Garage Ventures (4.52 per cent).
Fresh blood has clearly refreshed the mix. Nine entirely new categories and a whopping 45 new brands entered the fray. Among the debutants making an instant splash: Chocolates, Laptops/Notebooks, Range of Hair Care, Corporate-Pharma/Healthcare and Footwear. Stand-out new brands include Google Search Engine, Google Gemini, Lloyd Designer AC, Cadbury’s Dairy Milk Chocolate, Hero Splendor Plus Range and Joy Hello Sun Sunblock Anti-Tan Lotion, proof that even the most unexpected players are now eyeing cricket’s captive millions.
Conversely, 16 categories sat out IPL 19, including former stalwarts Ecom-Gaming, Cellular Phones-Smart Phones, Biscuits, Airlines and Fans. The message is clear: the ad economy is evolving faster than a T20 run-chase.
So while the on-field drama delivers its usual thrills, the commercial breaks are delivering something even more compelling, a masterclass in how to turn 22 yards of grass into serious brand territory. IPL 19 has shown that when the right mix of innovation and investment meets cricket fever, the ad scoreboard lights up in ways even the most optimistic analysts might not have predicted.


