Connect with us

MAM

Britannia Bourbon brings out fun shenanigans between friends in new TVC

Published

on

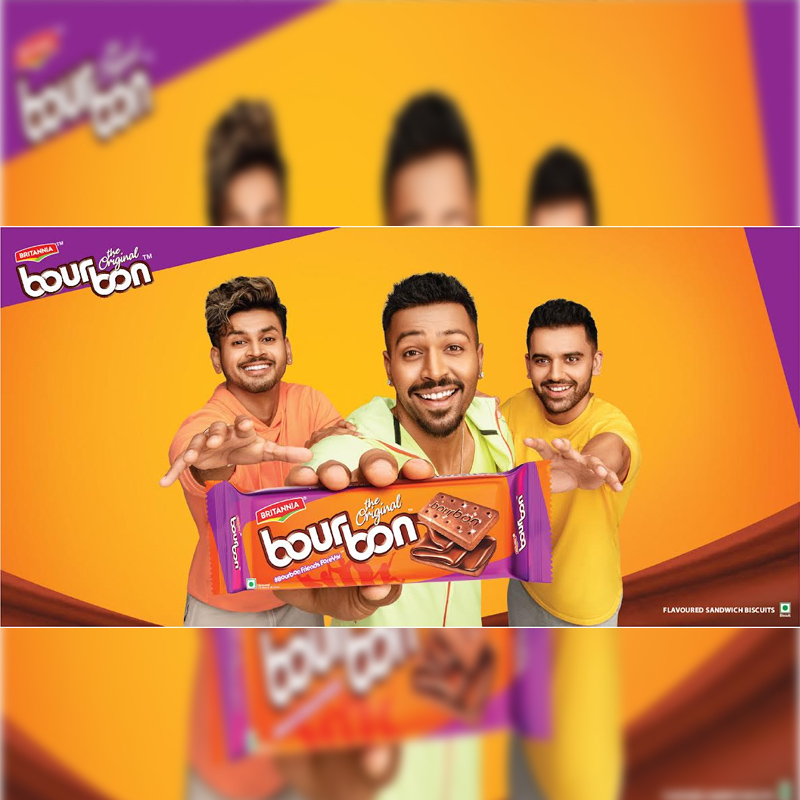
Mumbai: Britannia Bourbon has launched its new campaign by partnering with Indian cricketers – Hardik Pandya, Shreyas Iyer, and Deepak Chahar. The new TVC, which has Bourbon at the center of all the fun, brings out the desire for the iconic chocolaty snack. The TVC, conceptualised by McCann India- South, features the trio who are known to be friends on and off the cricket field.

The ad film depicts Hardik pulling a minor heist on Shreyas and Deepak and brings out the brand’s proposition of “Original Friendship”. The simple yet relatable creative is one that every friends’ gang can relate to, based on the premise that Bourbon is so delicious that you wouldn’t want to share it even with your best buddies. The TVC celebrates the mischievous, unpretentious bonds between real friends and Britannia Bourbon’s role of igniting fun between such friends.

“For over 65 years, Britannia Bourbon has been enjoyed across generations in almost every Indian household. We are really excited to introduce Hardik Pandya, Shreyas Iyer and Deepak Chahar as the new gang of friends. They have brought alive the brand idea in a fun and wicked way,” said Britannia Industries, VP- marketing, Vinay Subramanyam.

Advertisement

Speaking about the TVC, McCann Worldgroup head of creative – South, Sambit Mohanty said, “When you pull a fast one over a friend and it’s all in good fun, you know the friendship’s got to be original. Pretty much the sentiment captured in our new film for Britannia Bourbon – the original bourbon. For it depicts a friendship built on a solid foundation of wickedness, inappropriateness, and shenanigans.”

Advertisement
Click to comment

Leave a Reply

Your email address will not be published. Required fields are marked *

MAM

How Risk and Return Are Linked in Mutual Funds

Published

on

Risk and return maintain inverse proportionality within mutual funds – higher potential rewards accompany elevated volatility, while stability demands lower expectations. SEBI’s Riskometer (1-5 scale) standardizes visualization, but quantitative metrics reveal nuanced relationships across categories and market cycles.

Fundamental Risk-Return Relationship

Equity funds (Riskometer 4-5) deliver historical 12-16% CAGR alongside 18-25% standard deviation—large-cap 15% volatility, small-cap 30%+. Debt funds (1-2) yield 6-8% with 2-6% volatility. Hybrids (3) average 9-12% returns, 10-14% volatility.

Advertisement

Sharpe ratio measures return per risk unit – equity 0.7-0.9, debt 0.5-0.7 over complete cycles. Higher risk categories compensate through return premium capturing economic growth.

Volatility Metrics Explained

Standard Deviation: Annual NAV return dispersion—equity 18-22%, debt 4-6%. 

Advertisement

Maximum Drawdown: Peak-to-trough losses – equity 50%+ (2008), debt 8-12%. 

Beta: Market sensitivity – equity 0.9-1.1, debt 0.1-0.3.

Sortino Ratio focuses downside volatility—equity 1.0-1.3 favoring recoveries. 

Advertisement

Value at Risk (VaR) estimates 95% confidence, worst 1-month loss: equity 10-15%, debt 1-2%.

Category Risk-Return Profiles

Large-cap equity: 12-14% CAGR, 15% volatility, Sharpe 0.8. 

Advertisement

Mid/small-cap: 15-18%, 22-30% volatility, Sharpe 0.7. 

Corporate bond debt: 7-8%, 4% volatility, Sharpe 0.6.

Liquid funds: 6.5%, <1% volatility—capital preservation. 

Advertisement

Credit risk debt: 8.5%, 6% volatility—yield pickup. 

Hybrids: 10-12%, 12% volatility—balanced exposure.

Review types of mutual funds specifications confirming mandated asset allocations driving profiles.

Advertisement

Historical Risk-Return Tradeoffs (2000-2025)

Complete cycles: Equity 14% CAGR/18% volatility; 60/40 equity/debt 11%/11% volatility; debt 7.5%/5% volatility. Bull phases (2013-2021): equity 18%, debt 8%. Bear markets (2008, 2020): equity -50%/+80% swings, debt -10%/+10%.

Inflation-adjusted: Equity 8% real CAGR; debt 1.5% real—growth funding requires equity allocation.

Advertisement

Risk Capacity Assessment Framework

Short-term goals (1-3 years): Riskometer 1-2 (liquid/debt), 2-4% real returns. Medium-term (5-7 years): Level 3 (hybrid), 4-6% real. Long-term (10+ years): Level 4-5 (equity), 6-9% real.

Personal factors: Age (younger = higher risk), income stability, emergency fund coverage, other assets. Drawdown tolerance—20% comfortable vs 40% discomfort signals capacity limits.

Advertisement

Portfolio Construction Principles

Diversification: 60/40 equity/debt reduces volatility 40% versus equity-only while capturing 80% returns. 

Correlation: Equity/debt 0.3 average enables smoothing.

Advertisement

Rebalancing: Annual drift correction sells outperformers (equity +25%), buys underperformers (debt -5%). 

Style balance: Large-cap stability offsets mid-cap growth volatility.

Quantitative Risk Management Tools

Advertisement

Sharpe Ratio: >1.0 indicates efficient risk-taking. 

Information Ratio: Alpha per tracking error. 

Downside Deviation: Focuses losses only.

Advertisement

Stress Testing: 2008 scenario simulations reveal portfolio behavior extremes.

Conclusion

Higher mutual fund risk levels correlate with elevated return potential – equity 12-16% amid 18-25% volatility versus debt 6-8%/4-6%. Risk capacity matching, category diversification, rebalancing discipline, and quantitative metric interpretation align portfolios with personal tolerance across economic cycles.

Advertisement

Disclaimer: Investments in the securities market are subject to market risk, read all related documents carefully before investing.

Continue Reading

Advertisement News18
Advertisement
Advertisement Whtasapp
Advertisement Year Enders

Indian Television Dot Com Pvt Ltd

Signup for news and special offers!

Copyright © 2026 Indian Television Dot Com PVT LTD