MAM
Tata Motors signs three-year IPL deal with BCCI
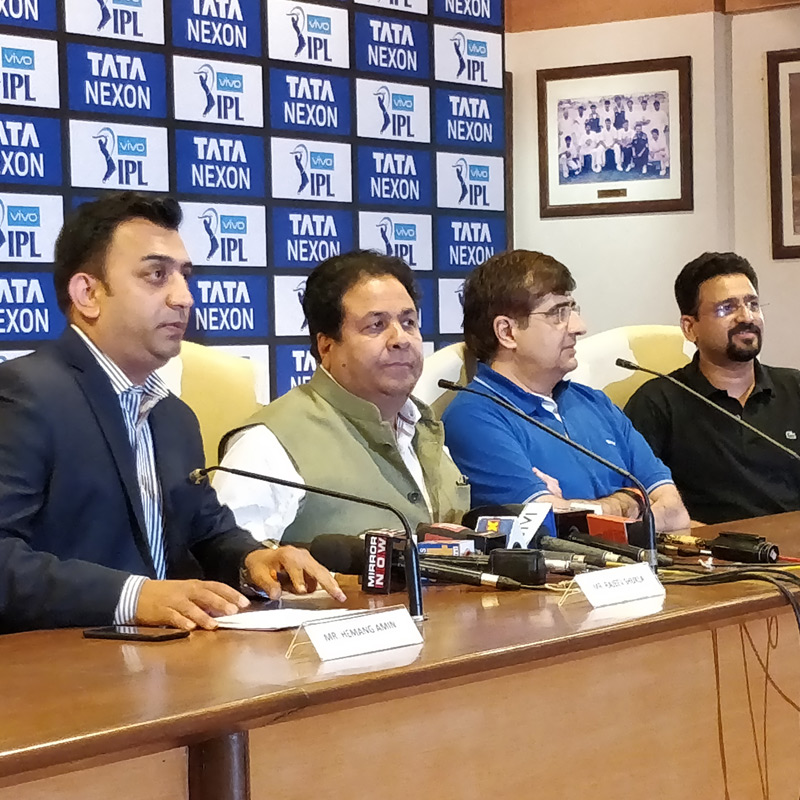
MUMBAI: The Board of Control for Cricket in India (BCCI) yesterday announced its three-year association with Tata Motors as the official partner for the Vivo Indian Premier League (IPL).
While brands now have started looking beyond cricket to spend advertising money, cricket continues to remain the favourite for every marketer across India with the IPL being the first preference. The BCCI had earlier announced Ceat Tyres as the strategic timeout partner and PayTM as the umpire partners for IPL 2018.
The car manufacturer’s Tata Nexon will drive in to occupy the space vacated by Maruti Suzuki, which decided to snap its ties with the IPL after having displayed Vitara Brezzas at IPL venues for two years. Maruti, in 2016, had signed a two-year deal with the BCCI to be an on-ground sponsor for the T20 league.

The matches will witness engagement activities such as the Tata Nexon Super Striker, wherein the best striker of the match/tournament will stand a chance to win daily and season awards including a Tata Nexon for the striker of the tournament.
Among other plans will be Tata Nexon Fan Catch, wherein anyone who takes a single-handed catch in a match stands a chance to win Rs 1 lakh and the season winner gets a Nexon. Tata Nexon will also leverage the 36 city Fan Park events for experiential and engaging brand experience.
Tata Motors president passenger vehicle business unit Mayank Pareek said, “We are delighted to have our ‘level nex’ performing brand Tata Nexon be associated with IPL, one of the biggest sporting event in the country that gives brands a very effective, large scale platform to connect with its consumers. Cricket is the most celebrated sport in India and the IPL is all about superlative performance, which is also the mantra for the Tata Nexon.”
Although this is the first time Tata Motors is investing in IPL on a huge scale, the company’s head of marketing for passenger vehicles business Vivek Srivatsa mentions that Tata Motors has always had sports in its DNA. Back in the day, Tata Motors founder Jamshedji Tata was a sports enthusiast and promoted football and other sports in India.
Srivatsa added, “Today, we are highly interested in sporting events and with IPL being the biggest sporting property in India, it was only natural for us to associate with the league and we want to get deeply involved.”
The brand will also see a lot of on-ground in-stadium activities which will be its core focus. Additionally, Tata Motors dealership stores will also see heavy promotions of the IPL and will run various contests for customers. A dedicated TVC campaign will be rolled out in April.
The synergy between a vehicle manufacturer and cricket may seem rather odd but Srivatsa is of the opinion that sports are taking centre stage for brands today. “Today sports are as important as academics in schools and with the government’s support sports will become a culture in itself,” he said.
Recently launched Tata Nexon has sold close to 20,000 units in the first six months. Associating with cricket or any other event eventually leads to sale and revenue for the brand and Srivatsa unhesitatingly added that although Nexon has received a positive response from customers so far, the company wants to make it the most popular passenger vehicle in every pocket of the country. He added that normal TVC and advertising only helps you reach metros and certain segments of the audience but cricket has a deep reach and Tata wants to use IPL to go deep in these markets which will eventually result in sales.
Also Read :
Paytm is the official ticketing partner of Kings XI Punjab’s home games for VIVO IPL 2018
YuppTV to stream IPL 2018 in several international markets


Risk and return maintain inverse proportionality within mutual funds – higher potential rewards accompany elevated volatility, while stability demands lower expectations. SEBI’s Riskometer (1-5 scale) standardizes visualization, but quantitative metrics reveal nuanced relationships across categories and market cycles.
Fundamental Risk-Return Relationship
Equity funds (Riskometer 4-5) deliver historical 12-16% CAGR alongside 18-25% standard deviation—large-cap 15% volatility, small-cap 30%+. Debt funds (1-2) yield 6-8% with 2-6% volatility. Hybrids (3) average 9-12% returns, 10-14% volatility.
Sharpe ratio measures return per risk unit – equity 0.7-0.9, debt 0.5-0.7 over complete cycles. Higher risk categories compensate through return premium capturing economic growth.
Volatility Metrics Explained
Standard Deviation: Annual NAV return dispersion—equity 18-22%, debt 4-6%.
Maximum Drawdown: Peak-to-trough losses – equity 50%+ (2008), debt 8-12%.
Beta: Market sensitivity – equity 0.9-1.1, debt 0.1-0.3.
Sortino Ratio focuses downside volatility—equity 1.0-1.3 favoring recoveries.
Value at Risk (VaR) estimates 95% confidence, worst 1-month loss: equity 10-15%, debt 1-2%.
Category Risk-Return Profiles
Large-cap equity: 12-14% CAGR, 15% volatility, Sharpe 0.8.
Mid/small-cap: 15-18%, 22-30% volatility, Sharpe 0.7.
Corporate bond debt: 7-8%, 4% volatility, Sharpe 0.6.
Liquid funds: 6.5%, <1% volatility—capital preservation.
Credit risk debt: 8.5%, 6% volatility—yield pickup.
Hybrids: 10-12%, 12% volatility—balanced exposure.
Review types of mutual funds specifications confirming mandated asset allocations driving profiles.
Historical Risk-Return Tradeoffs (2000-2025)
Complete cycles: Equity 14% CAGR/18% volatility; 60/40 equity/debt 11%/11% volatility; debt 7.5%/5% volatility. Bull phases (2013-2021): equity 18%, debt 8%. Bear markets (2008, 2020): equity -50%/+80% swings, debt -10%/+10%.
Inflation-adjusted: Equity 8% real CAGR; debt 1.5% real—growth funding requires equity allocation.
Risk Capacity Assessment Framework
Short-term goals (1-3 years): Riskometer 1-2 (liquid/debt), 2-4% real returns. Medium-term (5-7 years): Level 3 (hybrid), 4-6% real. Long-term (10+ years): Level 4-5 (equity), 6-9% real.
Personal factors: Age (younger = higher risk), income stability, emergency fund coverage, other assets. Drawdown tolerance—20% comfortable vs 40% discomfort signals capacity limits.
Portfolio Construction Principles
Diversification: 60/40 equity/debt reduces volatility 40% versus equity-only while capturing 80% returns.
Correlation: Equity/debt 0.3 average enables smoothing.
Rebalancing: Annual drift correction sells outperformers (equity +25%), buys underperformers (debt -5%).
Style balance: Large-cap stability offsets mid-cap growth volatility.
Quantitative Risk Management Tools
Sharpe Ratio: >1.0 indicates efficient risk-taking.
Information Ratio: Alpha per tracking error.
Downside Deviation: Focuses losses only.
Stress Testing: 2008 scenario simulations reveal portfolio behavior extremes.
Conclusion
Higher mutual fund risk levels correlate with elevated return potential – equity 12-16% amid 18-25% volatility versus debt 6-8%/4-6%. Risk capacity matching, category diversification, rebalancing discipline, and quantitative metric interpretation align portfolios with personal tolerance across economic cycles.
Disclaimer: Investments in the securities market are subject to market risk, read all related documents carefully before investing.


