MAM
MWA LAUNCHES CYLO CANNONBALL IPX7 WATERPROOF FLOATABLE BLUETOOTH SPEAKERS AT CES 2019
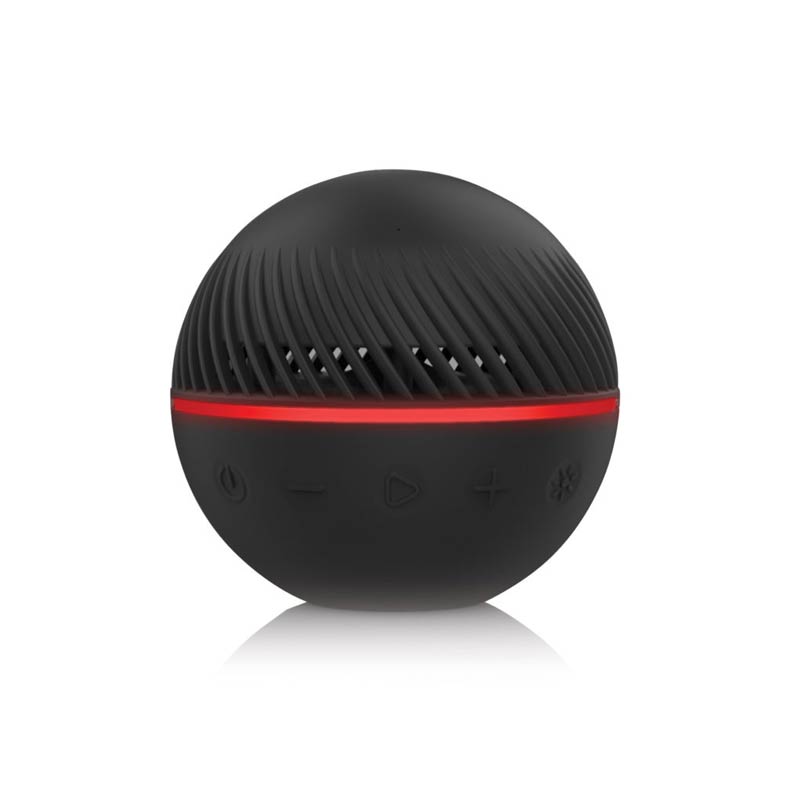
MiWorld Accessories (MWA), a leader in designer electronics, with brands including Cylo, Isaac Mizrahi, Bebe, Sugartone, Coby, and Kensie, announced today that they will launch an extension of their Cylo line of audio products at CES 2019, Booth #17540 Central Hall, the patent-pending Cannonball IPX7 waterproof floatable Bluetooth speakers, which feature true wireless capabilities that allows you to pair two speakers together for a totally immersive experience.
Patent-Pending Stabilization Technology for Use in Water and on Land
Priced at $49.99 and $79.99 respectively and available March 2019, the rugged Cannonball and Cannonball Max float in water with patent-pending stabilization technology for use on water and on land. Sand and dirt resistant for the beach and outdoors, they feature up to a 100 foot Bluetooth range — perfect for listening to music at parties, the beach, home, and in the office. In addition, the Cannonball speakers have a flat bottom to use indoors as a table or desktop speaker and feature a built-in mic to take phone calls.

Cylo Cannonball Bluetooth Speaker Line Info:
Cannonball Model:
4” diameter.
IPX7 waterproof.
Wireless chipset provides ability to pair two speakers.
Dirt and sand resistant.
Floats in water.
Patent-pending stabilization in water and on land.
Up to 60 Foot Bluetooth range.
Flat bottom for indoor table and desktop use.
MSRP: $49.99
Available: March 2019
Cannonball Max Model:
5” Diameter.
IPX7 waterproof.
Wireless chipset provides ability to pair two speakers.
Dirt and sand resistant.
Floats in water.
Patent-pending stabilization in water and on land.
Up to 100 Foot Bluetooth range.
Flat bottom for indoor table and desk use.
MSRP: $79.99.
Available: March 2019
MWA will be at CES 2019, Booth #17540 in the Central Hall, LVCC. CES is held January 8-11, 2019 in Las Vegas at the las Vegas Convention Center. To schedule CES press meeting with MWA, contact: Karen Thomas/Eva Yutani, Thomas PR (631) 549-7575, Emails: kthomas@thomaspr.com eyutani@thomaspr.com
MWA is redefining the way products are designed and manufactured, staying on top of fashion and trends that translate to unique innovations. Their team of designers and engineers is continually improving product design that utilizes advancements in the market and pushes the boundaries of everyday design. For more information, see the Cylo site at: www.gocylo.com and MWA at: www.miworldaccessories.com.


Risk and return maintain inverse proportionality within mutual funds – higher potential rewards accompany elevated volatility, while stability demands lower expectations. SEBI’s Riskometer (1-5 scale) standardizes visualization, but quantitative metrics reveal nuanced relationships across categories and market cycles.
Fundamental Risk-Return Relationship
Equity funds (Riskometer 4-5) deliver historical 12-16% CAGR alongside 18-25% standard deviation—large-cap 15% volatility, small-cap 30%+. Debt funds (1-2) yield 6-8% with 2-6% volatility. Hybrids (3) average 9-12% returns, 10-14% volatility.
Sharpe ratio measures return per risk unit – equity 0.7-0.9, debt 0.5-0.7 over complete cycles. Higher risk categories compensate through return premium capturing economic growth.
Volatility Metrics Explained
Standard Deviation: Annual NAV return dispersion—equity 18-22%, debt 4-6%.
Maximum Drawdown: Peak-to-trough losses – equity 50%+ (2008), debt 8-12%.
Beta: Market sensitivity – equity 0.9-1.1, debt 0.1-0.3.
Sortino Ratio focuses downside volatility—equity 1.0-1.3 favoring recoveries.
Value at Risk (VaR) estimates 95% confidence, worst 1-month loss: equity 10-15%, debt 1-2%.
Category Risk-Return Profiles
Large-cap equity: 12-14% CAGR, 15% volatility, Sharpe 0.8.
Mid/small-cap: 15-18%, 22-30% volatility, Sharpe 0.7.
Corporate bond debt: 7-8%, 4% volatility, Sharpe 0.6.
Liquid funds: 6.5%, <1% volatility—capital preservation.
Credit risk debt: 8.5%, 6% volatility—yield pickup.
Hybrids: 10-12%, 12% volatility—balanced exposure.
Review types of mutual funds specifications confirming mandated asset allocations driving profiles.
Historical Risk-Return Tradeoffs (2000-2025)
Complete cycles: Equity 14% CAGR/18% volatility; 60/40 equity/debt 11%/11% volatility; debt 7.5%/5% volatility. Bull phases (2013-2021): equity 18%, debt 8%. Bear markets (2008, 2020): equity -50%/+80% swings, debt -10%/+10%.
Inflation-adjusted: Equity 8% real CAGR; debt 1.5% real—growth funding requires equity allocation.
Risk Capacity Assessment Framework
Short-term goals (1-3 years): Riskometer 1-2 (liquid/debt), 2-4% real returns. Medium-term (5-7 years): Level 3 (hybrid), 4-6% real. Long-term (10+ years): Level 4-5 (equity), 6-9% real.
Personal factors: Age (younger = higher risk), income stability, emergency fund coverage, other assets. Drawdown tolerance—20% comfortable vs 40% discomfort signals capacity limits.
Portfolio Construction Principles
Diversification: 60/40 equity/debt reduces volatility 40% versus equity-only while capturing 80% returns.
Correlation: Equity/debt 0.3 average enables smoothing.
Rebalancing: Annual drift correction sells outperformers (equity +25%), buys underperformers (debt -5%).
Style balance: Large-cap stability offsets mid-cap growth volatility.
Quantitative Risk Management Tools
Sharpe Ratio: >1.0 indicates efficient risk-taking.
Information Ratio: Alpha per tracking error.
Downside Deviation: Focuses losses only.
Stress Testing: 2008 scenario simulations reveal portfolio behavior extremes.
Conclusion
Higher mutual fund risk levels correlate with elevated return potential – equity 12-16% amid 18-25% volatility versus debt 6-8%/4-6%. Risk capacity matching, category diversification, rebalancing discipline, and quantitative metric interpretation align portfolios with personal tolerance across economic cycles.
Disclaimer: Investments in the securities market are subject to market risk, read all related documents carefully before investing.


