MAM
Havas Group India forays into Eastern India; collaborates with Kolkata-based agency QED
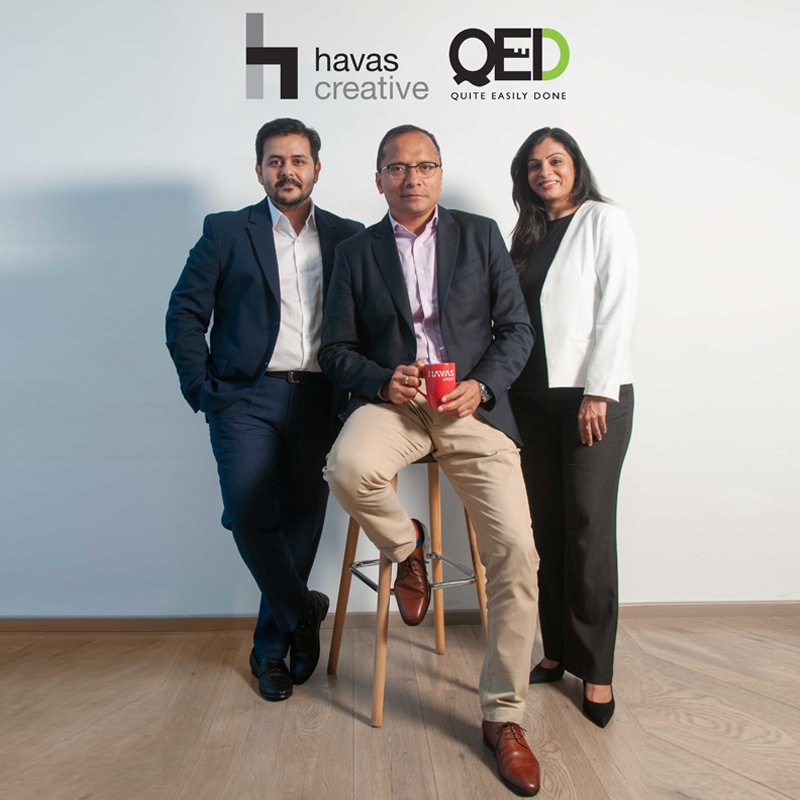
Mumbai: Paris-headquartered global advertising conglomerate Havas Group India has announced its foray into eastern India through a strategic tie-up between Havas Worldwide India and Kolkata-based digital marketing agency Quite Easily Done (QED).
The new entity, Havas QED, will partner with Havas Creative Group India, which has agencies, including Havas Worldwide India (creative), Havas CX (customer experience), Think Design (UI/UX), Conran Design Group Mumbai (design) and Shobiz (experiential). The agency will be led by QED founder & CEO Anisha Singh Motwani who will report to Havas Worldwide India (Creative) managing director Manas Lahiri. This collaboration aims to further drive the creative and digital excellence of Havas Creative Group India, the group stated.
Havas Group India has been strengthening and expanding its core products over the last three years through acquisitions, joint ventures, and strategic alliances. To add to this momentum, Havas Group India is now expanding its geographical footprint in India, with eastern India as the next stop to pursue potential opportunities.

Talking about the expansion, Havas Group India Group CEO Rana Barua stated, “Over the previous two years, we went from three to 10 companies through acquisitions, joint ventures, and strategic alliances, adding agencies such as Conran Design Group, Havas CX, Think Design, and Shobiz Havas under the creative umbrella. Media saw the addition of verticals including Havas Content, Havas Sports and Entertainment, Havas Market, and a strategic alliance with Tribes. This has resulted in tremendous growth and has propelled our reputation in the industry. Eastern India, without a doubt, offers unexplored commercial potential. This strategic alliance, I believe, is the first resolute step in the market and opens the door to the possibility of our fourth village in India, in the future.”
“We’ve been working with Anisha and the QED team for the past two years, and she’s one of the most promising entrepreneurs in India,” said Manas Lahiri. “This partnership is the best cultural fit for us, and I’m certain that our collaboration will help us add many new clients and write a new chapter in our growth journey,” he further added.
Founded in 2015, QED specialises in crafting captivating brand stories through content, design, creative communication, social media marketing strategies, SMS and email business communication, digital advertising, SEO, and paid search advertisements. The agency handles a wide range of clients including Nicco Park, The Park Hotels, Flurys, Heritage Dining, Indo-British Scholars Association, and many others. With over 15 years of experience in marketing, Motwani’s strength and forte lies in brand-building. She has been featured by Entrepreneurs of India in their #StartupStories feature in 2019, and in the Leading Women Entrepreneurs of India 2020 by Insights Success. Recognised as one of the most influential businesswomen of the year 2022 by Innovative Zone, she was also awarded the Woman Entrepreneur Award in 2022 by Great Companies.
QED CEO & founder Anisha Singh Motwani stated, “Our collaboration with Havas Worldwide India has been moving from strength to strength. This strategic alliance is an organic step towards further strengthening our partnership with the agency. I am confident that we will continue to deliver ground-breaking work together.”


Risk and return maintain inverse proportionality within mutual funds – higher potential rewards accompany elevated volatility, while stability demands lower expectations. SEBI’s Riskometer (1-5 scale) standardizes visualization, but quantitative metrics reveal nuanced relationships across categories and market cycles.
Fundamental Risk-Return Relationship
Equity funds (Riskometer 4-5) deliver historical 12-16% CAGR alongside 18-25% standard deviation—large-cap 15% volatility, small-cap 30%+. Debt funds (1-2) yield 6-8% with 2-6% volatility. Hybrids (3) average 9-12% returns, 10-14% volatility.
Sharpe ratio measures return per risk unit – equity 0.7-0.9, debt 0.5-0.7 over complete cycles. Higher risk categories compensate through return premium capturing economic growth.
Volatility Metrics Explained
Standard Deviation: Annual NAV return dispersion—equity 18-22%, debt 4-6%.
Maximum Drawdown: Peak-to-trough losses – equity 50%+ (2008), debt 8-12%.
Beta: Market sensitivity – equity 0.9-1.1, debt 0.1-0.3.
Sortino Ratio focuses downside volatility—equity 1.0-1.3 favoring recoveries.
Value at Risk (VaR) estimates 95% confidence, worst 1-month loss: equity 10-15%, debt 1-2%.
Category Risk-Return Profiles
Large-cap equity: 12-14% CAGR, 15% volatility, Sharpe 0.8.
Mid/small-cap: 15-18%, 22-30% volatility, Sharpe 0.7.
Corporate bond debt: 7-8%, 4% volatility, Sharpe 0.6.
Liquid funds: 6.5%, <1% volatility—capital preservation.
Credit risk debt: 8.5%, 6% volatility—yield pickup.
Hybrids: 10-12%, 12% volatility—balanced exposure.
Review types of mutual funds specifications confirming mandated asset allocations driving profiles.
Historical Risk-Return Tradeoffs (2000-2025)
Complete cycles: Equity 14% CAGR/18% volatility; 60/40 equity/debt 11%/11% volatility; debt 7.5%/5% volatility. Bull phases (2013-2021): equity 18%, debt 8%. Bear markets (2008, 2020): equity -50%/+80% swings, debt -10%/+10%.
Inflation-adjusted: Equity 8% real CAGR; debt 1.5% real—growth funding requires equity allocation.
Risk Capacity Assessment Framework
Short-term goals (1-3 years): Riskometer 1-2 (liquid/debt), 2-4% real returns. Medium-term (5-7 years): Level 3 (hybrid), 4-6% real. Long-term (10+ years): Level 4-5 (equity), 6-9% real.
Personal factors: Age (younger = higher risk), income stability, emergency fund coverage, other assets. Drawdown tolerance—20% comfortable vs 40% discomfort signals capacity limits.
Portfolio Construction Principles
Diversification: 60/40 equity/debt reduces volatility 40% versus equity-only while capturing 80% returns.
Correlation: Equity/debt 0.3 average enables smoothing.
Rebalancing: Annual drift correction sells outperformers (equity +25%), buys underperformers (debt -5%).
Style balance: Large-cap stability offsets mid-cap growth volatility.
Quantitative Risk Management Tools
Sharpe Ratio: >1.0 indicates efficient risk-taking.
Information Ratio: Alpha per tracking error.
Downside Deviation: Focuses losses only.
Stress Testing: 2008 scenario simulations reveal portfolio behavior extremes.
Conclusion
Higher mutual fund risk levels correlate with elevated return potential – equity 12-16% amid 18-25% volatility versus debt 6-8%/4-6%. Risk capacity matching, category diversification, rebalancing discipline, and quantitative metric interpretation align portfolios with personal tolerance across economic cycles.
Disclaimer: Investments in the securities market are subject to market risk, read all related documents carefully before investing.


