MAM
US ad spend sees modest rebound in Q1: Kantar Media
MUMBAI: Total ad expenditures in the first quarter of 2012 in the US increased by 2.6 per cent from a year ago and finished the period at $32.9 billion, according to data released by Kantar Media, a provider of strategic advertising and marketing information.
The gain represents a modest rebound compared to flat spending in the second half of 2011.
Kantar Media US chief research officer Jon Swallen said, “After a sluggish start in January, the pace of measured ad spending quickly accelerated and grew at an average rate of more than four per cent during February and March, the best performance in more than a year. Early figures from the second quarter indicate continued modest growth with improvement trickling down to media that have been lagging the overall advertising market.”

Measured ad spending by media
Ad expenditures increased across every television media type in the first quarter of 2012. Sports programming was the engine behind year-over-year gains of 7.4 per cent in cable TV and seven per cent in Network TV spending. More than two-thirds of this dollar volume growth came from sporting events, led by the NCAA Men’s Basketball Tournament and NFL post-season games.
Comparisons were helped by a calendar timing shift that moved ad money for the NCAA Final Four games out of April and into the very last day of the first quarter.
Syndication TV budgets rose by 15.7 per cent and were aided by more hours of programming as well as audience ratings gains. Spot TV, benefitting from a biennial business cycle tied to political
advertising and Olympics in even-number years, saw spending increase 2.5 per cent versus a year ago.
Spanish Language TV expenditures were up 20.7 per cent, reflecting higher automotive spending and larger allocations from a broad range of consumer packaged goods marketers.
Other Spanish Language media types also posted gains, albeit from much smaller bases. Year-over-year spending in Spanish language magazines surged by 26.5 per cent and Spanish language newspapers increased by 4.7 per cent.
Outside the Hispanic market, print media continued to lose ground. Expenditures in consumer magazines dropped 4.2 per cent from a year ago and budgets in Sunday magazines were off 4.6 per cent due to cutbacks from auto manufacturers, food companies and prescription drug marketers.
Local newspaper ad spending fell 3.9 per cent and national newspapers declined by 7.7 per cent, each hurt by substantial reductions from the financial service, travel and telecom categories.
The losses in newspaper spending were consistent with reductions in the amount of space sold.
Within the universe of 2,811 Internet sites that Kantar Media measured for at least a full year, display expenditures fell by 4.1 per cent during the first quarter. The overall spending reduction was primarily attributable to fewer display ads appearing on the average web page, with some offset from higher average CPMs. There was also a sharp split between popular, high-traffic sites, where spending was close to flat year-over-year, and the many small, long-tail sites, which saw an aggregate percentage decline in the mid-teens.
Outdoor advertising investments rose 4.6 per cent, the eighth consecutive quarter of year-over-year increases. Higher spending from core categories including Local Serices, Retail and Restaurants were a prime catalyst.
Measured ad spending by advertiser
Spending among the ten largest advertisers in the opening quarter of 2012 was $3,922.3 million, a 5.5 per cent decline compared to a year ago period. Among the Top 100 marketers, a diversified group accounting for more than two-fifths of all measured ad expenditures, budgets climbed by 3.4 per cent.
Procter And Gamble was the top-ranked advertiser with spending of $685.0 million, down 4.7 per cent. The decline comes against the backdrop of a Q1 announcement by P&G that it plans to tighten the reins on marketing budgets and shift more money out of traditional media.
Comcast was the second largest spender during the period with outlays of $482.7 million, an increase of 4.3 per cent that was propelled by the ongoing rollout of its Xfinity service. In contrast, media expenditures at rival telecom companies fell sharply. AT&T slashed its spending by 31.6 per cent, to $388.9 million, as the company deferred budgets to support an upcoming marketing push timed to the Summer Olympics.
Verizon Communications trimmed its expenditures by 9.2 per cent to $358.6 million.
Only two automotive advertisers landed in the Top Ten. General Motors reduced spending by 17.8 per cent to $403.3 million, the seventh consecutive quarterly decline for the automaker. Toyota Motor spent $327.8 million, an increase of 8.6 per cent.
News Corp registered the largest per cent gain among the Top Ten as budgets jumped 24.9 per cent to $357.5 million. Time Warner also had a healthy gain as its quarterly spending reached $301.5 million, up by nine per cent. Results for both companies were shaped by their movie studio divisions.
Measured ad spending by category
Expenditures for the ten largest categories grew by 3.1 per cent in the first quarter of 2012 to $20.73 billion. Automotive was the top category with $3,528.9 million of spending, down 1.5 per cent. Manufacturer budgets contracted by 6.9 per cent primarily because there were fewer marketing launches in 2012 to provide impetus for higher budget levels. Dealer spending remained
robust with a gain of 8.7 per cent amidst a strong retail sales climate.
Retail was the second largest category by dollar volume with media investments of $3,373.5 million, up by 8.6 per cent. The department store segment was especially strong, spurred by a significant repositioning campaign from JC Penney which in turn prompted most rival brands to increase their own budgets.
Financial services posted the highest rate of growth among the Top Ten categories, a 10.1 per cent increase to $2,120.6 million. Fierce competition among credit card issuers, revitalised marketing programs for retirement planning services and higher budgets from tax preparation firms were the growth drivers.
Expenditures for personal care products rose by 4.8 per cent to $1,476.6 million and the Restaurant category boosted its spending by 3.7 per cent to $1,523.0 million.
Telecom advertising remained soft during the quarter and finished 2.8 per cent lower at $2,102.6 million. Sharp budget reductions from wireless carriers were only partially offset by increases from TV service providers and mobile device manufacturers.


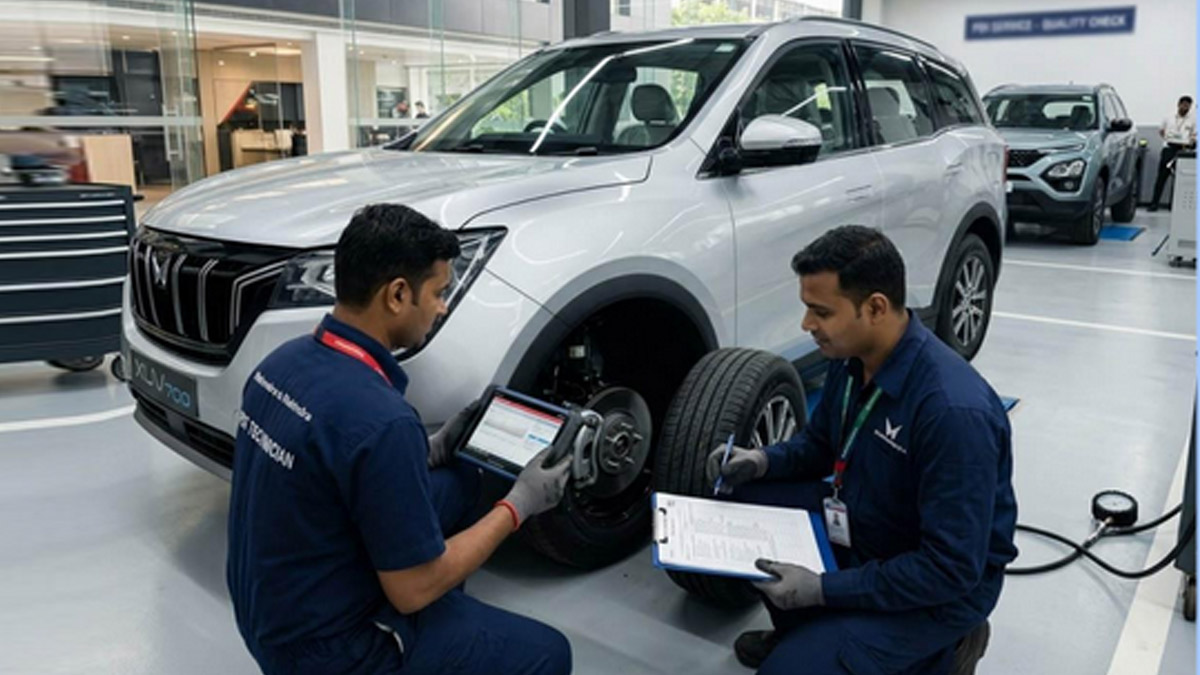
You have spent weeks researching, test driven a few options, finalised the colour and variant, and are now days away from taking delivery of your new car. It feels like the hard part is over. But there is one step that most buyers skip entirely, and it is the one that protects everything else. Understanding what PDI meaning covers and why it matters could save you from discovering a Rs 20,000 to Rs 80,000 problem after you have already signed the papers.
PDI stands for Pre-Delivery Inspection. It is a structured check that happens before your car is handed over to you. A proper PDI car service covers everything from paint quality and panel alignment to electrical systems, fluid levels and tyre pressure. Dealers are supposed to conduct this before delivery, but the depth of the check varies widely. And if the buyer does not know what to look for, problems slip through.
What Does a PDI Actually Cover?
A thorough PDI checks the car across four broad categories:
| Category | What Gets Checked | Common Issues Found |
| Exterior | Paint quality, panel gaps, glass, lights, tyres | Paint chips, uneven panel alignment, scratched glass |
| Interior | Seat upholstery, dashboard, AC, infotainment, switches | Loose trims, non-functional buttons, squeaks and rattles |
| Mechanical | Engine bay, fluids, battery, brakes, steering | Low fluid levels, minor leaks, battery not fully charged |
| Electrical | All lights, windows, central locking, sensors | Malfunctioning sensors, flickering displays, USB ports |
Each of these categories can hide issues that are minor at delivery but expensive if left unaddressed. A small paint chip near a door edge, for example, can lead to rust in a humid city like Mumbai or Chennai within 12 to 18 months.
What It Can Cost You to Skip the PDI
Here is a realistic look at what buyers have discovered after delivery that a proper PDI would have caught before:
• Paint defects requiring respraying: Rs 8,000 to Rs 25,000 depending on the panel
• Misaligned panels or doors that need workshop adjustment: Rs 3,000 to Rs 8,000
• Non-functional infotainment unit needing replacement: Rs 15,000 to Rs 40,000
• Scratched windshield that needs full replacement: Rs 6,000 to Rs 18,000
• AC not cooling properly due to low refrigerant: Rs 2,000 to Rs 5,000
• Tyre with a slow puncture from storage damage: Rs 3,000 to Rs 6,000
The total exposure from a single missed PDI can range from Rs 5,000 for minor issues to Rs 80,000 or more if multiple problems are found post-delivery. More importantly, proving that a defect existed before delivery becomes significantly harder once you have taken the keys.
Why Dealer PDIs Are Not Always Enough
Most dealerships do conduct a pre-delivery check on their own, but the process is not always as rigorous as it should be. There are a few reasons for this:
High Delivery Volumes
During festive season or at the end of a financial year, dealerships handle a surge in deliveries. When a service team is processing 15 to 20 cars a day, the depth of each check inevitably suffers.
Incentive Misalignment
Dealership staff are often incentivised on delivery speed and customer satisfaction scores. Finding a defect and sending a car back for rework delays delivery and affects scores. The incentive to look harder is not always present.
Buyer Unawareness
Most buyers arrive at delivery excited and in a hurry to leave. Without knowing what to look for, they miss things that a trained eye would catch immediately. Dealers know this, and the pressure to be thorough is lower when buyers are not asking questions.
What You Should Check Yourself at Delivery
Even if the dealer has completed their PDI, spend 20 to 30 minutes doing your own check at delivery. Here is a quick reference:
Check How to Do It Time Required Walk around in daylight Check all panels for scratches, chips and dents 5 minutes Open every door Check seals, check for rattles, test all windows 3 minutes Check interior thoroughly Test every button, switch and screen 5 minutes Start the car Look for warning lights, check AC, check all lights 5 minutes Check the boot Look for spare tyre, tools, jack and damage 2 minutes Inspect tyres Check pressure and look for sidewall damage 3 minutes
The Bottom Line
A PDI is not a formality. It is the last line of defence between you and a problem that the manufacturer or dealer should have fixed before you paid for the car.
Take the time to understand what the check involves, ask your dealer for confirmation that it has been completed, and do your own walkthrough at delivery. Twenty minutes of attention at this stage can save you weeks of workshop visits and tens of thousands of rupees down the line.