MAM
redBus resumes intra-state bookings with 80+ private bus operators in Gujarat

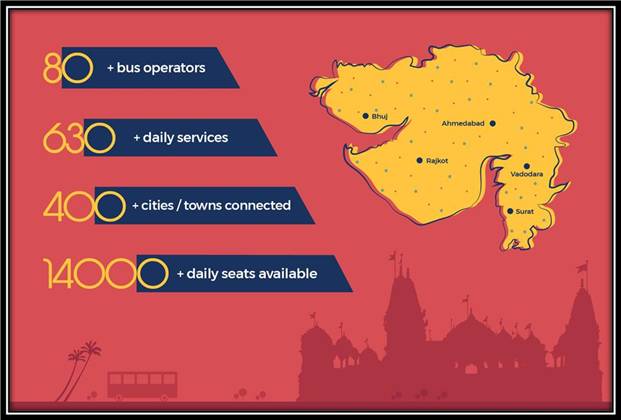
redBus, India’s leading online bus ticketing platform announces resumption of the services of 80+ private bus operators on its platform in Gujarat, thus opening up around 5000+ intra-state routes connecting cities such as Ahmedabad, Vadodara, Surat, Rajkot and Bhuj.
The resumption of intra-state bus travel will effectively end the long and anxious wait for thousands of travellers who were looking to travel during the past few months amidst the lockdown. About 630+ private buses will now ply on these routes with a daily capacity of 14000+ seats, expecting a high demand for travel to big cities as thousands of people hope to return to work at the earliest.
In order to help travellers tide over the confusion of opening up of specific bus routes, redBus recently introduced the concept of pre-registration on its platform. This helps users to keep track of the opening up of their desired bus routes by giving some basic information such as phone number and email id along with the route. The users are then subsequently notified when the buses become available on redBuson their desired routes. As of 10thJune, around 5.5 lakh customers across India had already availed the pre-registration feature.

redBus has also launched, ‘Safety+’, a unique certification for bus operators who meet the highest standards of safety and sanitisation. The redBus ticketing platform indicates operators with this certification with a Safety+ tag next to the bus listing, enabling users to opt for such operators or buses.
The buses listed under ‘Safety+’ will ensure the following:

redBus has also listed out a set of passenger guidelines encouraging passengers to travel responsibly for a safe and hassle-free journey. These guidelines seek to ensure safety of bus travel. Some of the measures listed in the passenger guidelines are illustrated below:


Risk and return maintain inverse proportionality within mutual funds – higher potential rewards accompany elevated volatility, while stability demands lower expectations. SEBI’s Riskometer (1-5 scale) standardizes visualization, but quantitative metrics reveal nuanced relationships across categories and market cycles.
Fundamental Risk-Return Relationship
Equity funds (Riskometer 4-5) deliver historical 12-16% CAGR alongside 18-25% standard deviation—large-cap 15% volatility, small-cap 30%+. Debt funds (1-2) yield 6-8% with 2-6% volatility. Hybrids (3) average 9-12% returns, 10-14% volatility.
Sharpe ratio measures return per risk unit – equity 0.7-0.9, debt 0.5-0.7 over complete cycles. Higher risk categories compensate through return premium capturing economic growth.
Volatility Metrics Explained
Standard Deviation: Annual NAV return dispersion—equity 18-22%, debt 4-6%.
Maximum Drawdown: Peak-to-trough losses – equity 50%+ (2008), debt 8-12%.
Beta: Market sensitivity – equity 0.9-1.1, debt 0.1-0.3.
Sortino Ratio focuses downside volatility—equity 1.0-1.3 favoring recoveries.
Value at Risk (VaR) estimates 95% confidence, worst 1-month loss: equity 10-15%, debt 1-2%.
Category Risk-Return Profiles
Large-cap equity: 12-14% CAGR, 15% volatility, Sharpe 0.8.
Mid/small-cap: 15-18%, 22-30% volatility, Sharpe 0.7.
Corporate bond debt: 7-8%, 4% volatility, Sharpe 0.6.
Liquid funds: 6.5%, <1% volatility—capital preservation.
Credit risk debt: 8.5%, 6% volatility—yield pickup.
Hybrids: 10-12%, 12% volatility—balanced exposure.
Review types of mutual funds specifications confirming mandated asset allocations driving profiles.
Historical Risk-Return Tradeoffs (2000-2025)
Complete cycles: Equity 14% CAGR/18% volatility; 60/40 equity/debt 11%/11% volatility; debt 7.5%/5% volatility. Bull phases (2013-2021): equity 18%, debt 8%. Bear markets (2008, 2020): equity -50%/+80% swings, debt -10%/+10%.
Inflation-adjusted: Equity 8% real CAGR; debt 1.5% real—growth funding requires equity allocation.
Risk Capacity Assessment Framework
Short-term goals (1-3 years): Riskometer 1-2 (liquid/debt), 2-4% real returns. Medium-term (5-7 years): Level 3 (hybrid), 4-6% real. Long-term (10+ years): Level 4-5 (equity), 6-9% real.
Personal factors: Age (younger = higher risk), income stability, emergency fund coverage, other assets. Drawdown tolerance—20% comfortable vs 40% discomfort signals capacity limits.
Portfolio Construction Principles
Diversification: 60/40 equity/debt reduces volatility 40% versus equity-only while capturing 80% returns.
Correlation: Equity/debt 0.3 average enables smoothing.
Rebalancing: Annual drift correction sells outperformers (equity +25%), buys underperformers (debt -5%).
Style balance: Large-cap stability offsets mid-cap growth volatility.
Quantitative Risk Management Tools
Sharpe Ratio: >1.0 indicates efficient risk-taking.
Information Ratio: Alpha per tracking error.
Downside Deviation: Focuses losses only.
Stress Testing: 2008 scenario simulations reveal portfolio behavior extremes.
Conclusion
Higher mutual fund risk levels correlate with elevated return potential – equity 12-16% amid 18-25% volatility versus debt 6-8%/4-6%. Risk capacity matching, category diversification, rebalancing discipline, and quantitative metric interpretation align portfolios with personal tolerance across economic cycles.
Disclaimer: Investments in the securities market are subject to market risk, read all related documents carefully before investing.


