MAM
Kaushik Roy re-elected as prez IAA – India Chapter, Swamy is VP
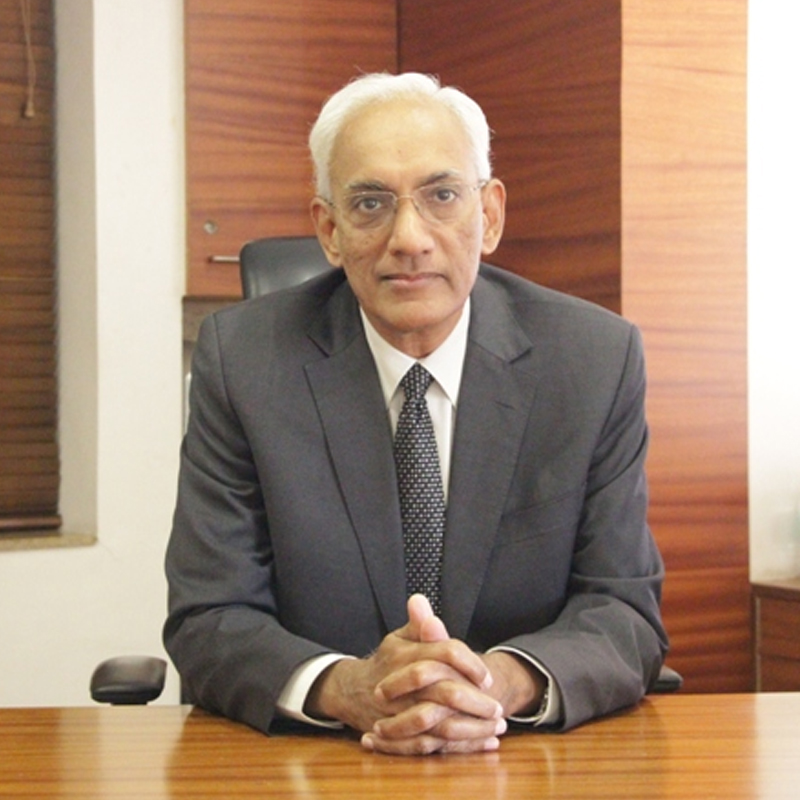
MUMBAI: Reliance Industries president – Brand Strategy & Marketing Communication Kaushik Roy has been re-elected as the president of the India Chapter of the International Advertising Association (IAA-IC) for the year 2011-12.
Roy was elected unanimously for the second term at IAA-IC’s annual general meeting held in Mumbai.
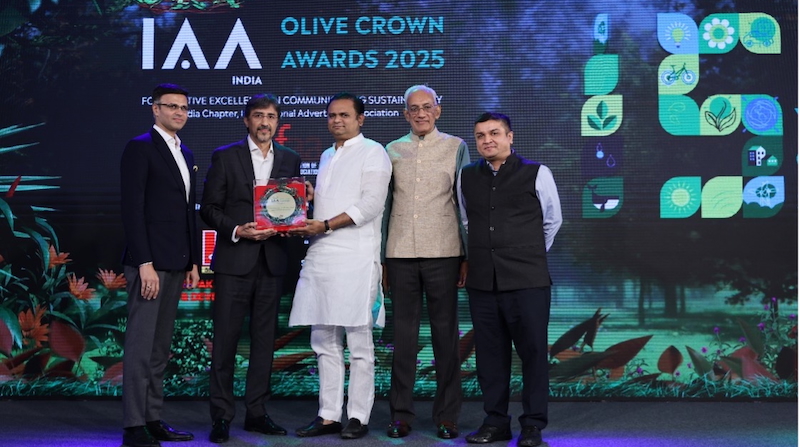
In his first term as president, Roy had launched India’s first Green Award – Olive Crown for creative excellence in communicating sustainability. The IAA-IC also conducted a seminar on the agency of the future entitled ‘Agency 2.5’ by Tim Williams of the USA.

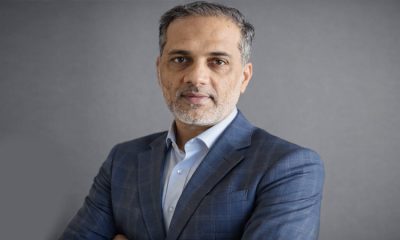
Meanwhile, RK Swamy BBDO CMD Srinivasan K Swamy, who was the honorary secretary of the India Chapter for the past two years, is the new vice president.
The new managing committee includes:
MG Parameswaran as Hon. Secretary
Jaideep Gandhi as Hon. Treasurer
Sam Balsara (Member)
Ramesh Narayan (Member)
Avinash Pandey (Member)
Kunal Lalani (Member)
Neeraj Roy (Co-opted Member)
Bhaskar Das (Member)
Raj Nayak (Ex officio) Immediate Past President.
Pheroza Bilimoria (Special Invitee) Global Hon Secretary and Member of the World Board.
Pradeep Guha (Special Invitee) Global VP and Area Director, Asia Pacific and Member of the World Board
Spread over 56 Chapters in 76 Countries with over 4,000 members worldwide, the IAA champions advertising as a force for growth in all free market societies.


MAM
Joy Personal Care rolls out Ubtan Face Wash TVC with Shah Rukh Khan
New film pairs star power with simple skincare pitch for summer glow

MUMBAI: Joy Personal Care has unveiled a new television commercial for its Ubtan Face Wash, bringing together Shah Rukh Khan and Sanya Malhotra in a light-hearted campaign aimed at simplifying everyday skincare choices.
The film, which marks the product’s television debut, is set in a retail environment where Malhotra is seen navigating a shelf full of options before Khan steps in with his trademark charm to offer a fuss-free solution. The narrative leans on humour and relatability, turning a routine purchase into a playful exchange.
At its core, the campaign promotes the brand’s ubtan-based formulation, which blends traditional ingredients such as turmeric, saffron and sandalwood to address common summer concerns like tanning and dullness. The messaging keeps things simple, positioning the product as an easy addition to daily routines rather than a complicated skincare step.
RSH Global co-founder and chairman Sunil Agarwal said, “As summer sets in and exposure to sun and heat intensifies, skincare concerns like tan and dullness become more pronounced. Consumers today are looking for solutions that deliver visible results while remaining easy to incorporate into daily routines.”
Echoing the consumer-first approach, RSH Global chief marketing officer Poulomi Roy said, “Through this campaign, we have brought that insight to life in a simple and engaging way, showing how Joy Ubtan Face Wash makes traditional skincare easy and effective. Shah Rukh Khan and Sanya Malhotra add relatability and charm, helping the product connect more strongly with audiences.”
Sharing his experience, Shah Rukh Khan said the campaign stood out for its simplicity and everyday appeal, while Sanya Malhotra highlighted the natural chemistry and playful tone of the shoot.
The campaign will be amplified across television, digital and social platforms, signalling a wider push as the brand looks to strengthen its position in the competitive face wash segment.
Part of RSH Global, Joy Personal Care continues to build visibility through celebrity-led campaigns and sports partnerships, including associations with Kolkata Knight Riders, Delhi Capitals and Gujarat Giants.
With familiar faces, a breezy storyline and a focus on everyday concerns, the latest campaign keeps things straightforward. In a crowded skincare aisle, sometimes the easiest answer is also the most effective one.


