MAM
Embassy Services runs a road safety awareness campaign
India accounts for 12 per cent of the world’s road deaths. In 2018 alone, the World Health Organization (WHO) estimates that almost 300,000 people died due to road accidents in the country. This number remains astonishingly high in comparison to other countries where the use of motor vehicles is much higher. The impact of human life loss is enormous, especially on the economy. A World Bank study has found that if India successfully reduces half of road deaths and injuries between 2014 and 2038, it could add 14 per cent to its GDP per capita. Unfortunately, the unprivileged are drastically affected by the after impact of vehicular accidents. Pedestrians, cyclists and motorcyclists, usually hailing from the low and middle-income strata, account for more than 50 per cent of the road traffic deaths in India.
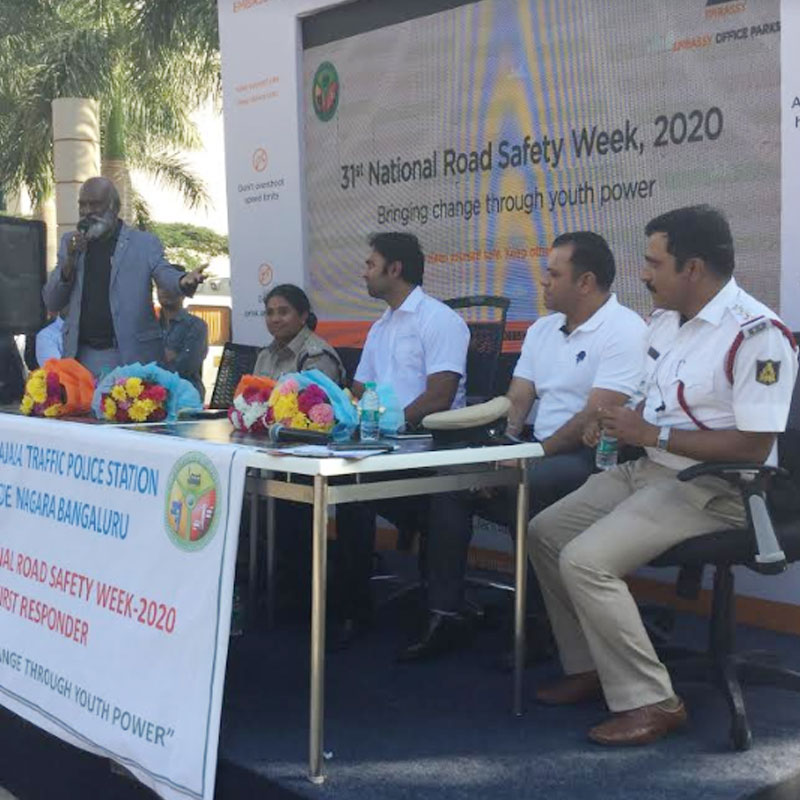
Road accidents affect people’s lives and often drive them to poverty. Awareness on Road accidents should be a multi-sectorial effort that involves law enforcement, governance, (the issue of driving licenses and vehicle registration), engineering (appropriate road design) and post-accident trauma care and management. On the occasion of 31st road safety awareness week aligned with the UN mandate, the Government conducted a road safety awareness campaign in India seeking support from all its citizens and big businesses. The motto this year was “Bringing change through youth power.” Embassy Services Pvt. Ltd. (ESPL), the leading IFM company organized a week-long road safety awareness program communicating safety messages through collateral and across all their office parks. They marked the final day on 22 January in Manyata Business Park amphitheater with a bike rally and by inviting traffic police on-board to help and educate every road traveller with their safety awareness presentations.
ESPL is strongly instrumental in supporting corporates to fulfill their responsibility for society at large and constantly taking initiatives to make the world a better place. Embassy Services Private Limited is a multi-faceted company that was founded in 1993, delivering end to end Integrated Facility Management services to over 150 clients, covering 70+ million sq.ft. of space, across 12 states in India. Embassy Services has a PAN-India presence covering real estate portfolio spectrum of commercial, residential, industrial, co-working, retail, hospitality, and other properties giving them a unique advantage of having a reservoir of deep technical knowledge to cater to most requirements. These trusted leaders of IFM are committed to delivering operational efficiency, environmental sustainability and engaging experiences. Embassy Services invests in the right talent to achieve sustainable goals through 4 pillars – Client, People, Infrastructures and Communities.

These pillars create innovative and forward-thinking solutions for a better tomorrow and help businesses in implementing sustainable initiatives using various methodologies in the properties managed by them. Embassy Services Pvt. Ltd. provides a range of services for all verticals of real estate including energy management, water management, transport management as well as the environment, health, safety and security services. They work closely with the clients to implement solutions that improve the efficiency of energy, water and other resource management.


Risk and return maintain inverse proportionality within mutual funds – higher potential rewards accompany elevated volatility, while stability demands lower expectations. SEBI’s Riskometer (1-5 scale) standardizes visualization, but quantitative metrics reveal nuanced relationships across categories and market cycles.
Fundamental Risk-Return Relationship
Equity funds (Riskometer 4-5) deliver historical 12-16% CAGR alongside 18-25% standard deviation—large-cap 15% volatility, small-cap 30%+. Debt funds (1-2) yield 6-8% with 2-6% volatility. Hybrids (3) average 9-12% returns, 10-14% volatility.
Sharpe ratio measures return per risk unit – equity 0.7-0.9, debt 0.5-0.7 over complete cycles. Higher risk categories compensate through return premium capturing economic growth.
Volatility Metrics Explained
Standard Deviation: Annual NAV return dispersion—equity 18-22%, debt 4-6%.
Maximum Drawdown: Peak-to-trough losses – equity 50%+ (2008), debt 8-12%.
Beta: Market sensitivity – equity 0.9-1.1, debt 0.1-0.3.
Sortino Ratio focuses downside volatility—equity 1.0-1.3 favoring recoveries.
Value at Risk (VaR) estimates 95% confidence, worst 1-month loss: equity 10-15%, debt 1-2%.
Category Risk-Return Profiles
Large-cap equity: 12-14% CAGR, 15% volatility, Sharpe 0.8.
Mid/small-cap: 15-18%, 22-30% volatility, Sharpe 0.7.
Corporate bond debt: 7-8%, 4% volatility, Sharpe 0.6.
Liquid funds: 6.5%, <1% volatility—capital preservation.
Credit risk debt: 8.5%, 6% volatility—yield pickup.
Hybrids: 10-12%, 12% volatility—balanced exposure.
Review types of mutual funds specifications confirming mandated asset allocations driving profiles.
Historical Risk-Return Tradeoffs (2000-2025)
Complete cycles: Equity 14% CAGR/18% volatility; 60/40 equity/debt 11%/11% volatility; debt 7.5%/5% volatility. Bull phases (2013-2021): equity 18%, debt 8%. Bear markets (2008, 2020): equity -50%/+80% swings, debt -10%/+10%.
Inflation-adjusted: Equity 8% real CAGR; debt 1.5% real—growth funding requires equity allocation.
Risk Capacity Assessment Framework
Short-term goals (1-3 years): Riskometer 1-2 (liquid/debt), 2-4% real returns. Medium-term (5-7 years): Level 3 (hybrid), 4-6% real. Long-term (10+ years): Level 4-5 (equity), 6-9% real.
Personal factors: Age (younger = higher risk), income stability, emergency fund coverage, other assets. Drawdown tolerance—20% comfortable vs 40% discomfort signals capacity limits.
Portfolio Construction Principles
Diversification: 60/40 equity/debt reduces volatility 40% versus equity-only while capturing 80% returns.
Correlation: Equity/debt 0.3 average enables smoothing.
Rebalancing: Annual drift correction sells outperformers (equity +25%), buys underperformers (debt -5%).
Style balance: Large-cap stability offsets mid-cap growth volatility.
Quantitative Risk Management Tools
Sharpe Ratio: >1.0 indicates efficient risk-taking.
Information Ratio: Alpha per tracking error.
Downside Deviation: Focuses losses only.
Stress Testing: 2008 scenario simulations reveal portfolio behavior extremes.
Conclusion
Higher mutual fund risk levels correlate with elevated return potential – equity 12-16% amid 18-25% volatility versus debt 6-8%/4-6%. Risk capacity matching, category diversification, rebalancing discipline, and quantitative metric interpretation align portfolios with personal tolerance across economic cycles.
Disclaimer: Investments in the securities market are subject to market risk, read all related documents carefully before investing.


