MAM
Ankur Aggarwal elected chairman of CropLife India during 44th AGM
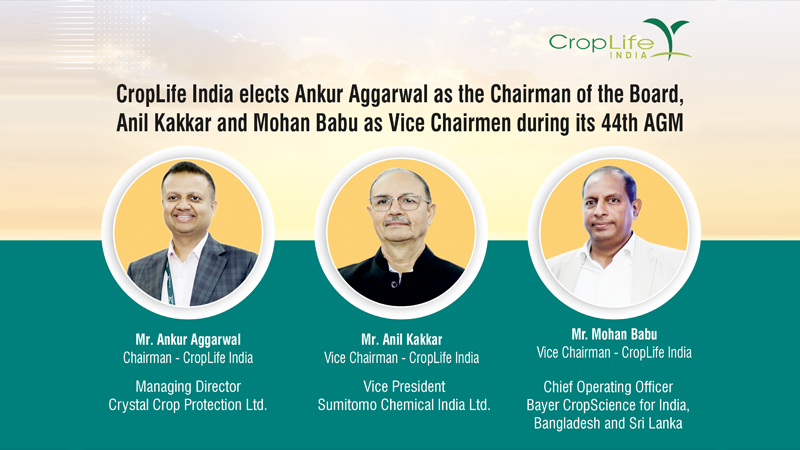
Mumbai: CropLife India announces a significant leadership transition with the election of Crystal Crop Protection Ltd, managing director, Ankur Aggarwal as the new chairman of the board during its 44th Annual General Meeting. Aggarwal succeeds K. C. Ravi, who served as chairman for the past four years, bringing his extensive expertise to guide the organisation’s mission of advancing sustainable agriculture in India.
The AGM also re-elected Sumitomo Chemical India, vice president, Anil Kakkar as vice chairman for a fourth consecutive year. Additionally, Bayer CropScience, chief operating officer for India, Bangladesh, and Sri Lanka, Mohan Babu joins the leadership as the second vice chairman of the board.
Aggarwal emphasised the challenges facing India’s agriculture, stating, “India is confronted with a pressing challenge: decreasing agricultural landholdings alongside a growing population, which is increasing at about 0.8 per cent annually. This scenario heightens the demand for food production, putting pressure on food systems and necessitating innovative solutions for food security. To address this, the adoption of sustainable agricultural practices, efficient resource management, and responsible use of crop protection solutions will be essential for maximising productivity on existing farmland. As the Chairman of CropLife India, we remain committed to improving the lives of Indian farmers. We are dedicated to providing them with science-based solutions that ensure effective and sustainable crop protection.”

CropLife India, secretary general, Durgesh Chandra expressed confidence in the new leadership, stating, “It will be our earnest endeavor in collaborating closely with Ankur Aggarwal and the board of directors, to fulfill our responsibility in delivering the latest and safest innovations. Together, we aim to educate farmers on the safe and responsible use of crop protection solutions, ensuring they can effectively protect their crops while prioritising safety and sustainability.”
With its members working closely with farmers, the scientific community, and policymakers, CropLife India continues to tackle both current and future agricultural challenges. Member companies have pledged to invest 10 billion Euros in precision agriculture by 2030, along with another 4 billion Euros in biopesticides development, reinforcing the commitment to sustainable growth.
The new leadership is set to steer CropLife India towards a more resilient agricultural future, prioritising innovative technologies and sustainable practices to help farmers meet growing demands.

Risk and return maintain inverse proportionality within mutual funds – higher potential rewards accompany elevated volatility, while stability demands lower expectations. SEBI’s Riskometer (1-5 scale) standardizes visualization, but quantitative metrics reveal nuanced relationships across categories and market cycles.
Fundamental Risk-Return Relationship
Equity funds (Riskometer 4-5) deliver historical 12-16% CAGR alongside 18-25% standard deviation—large-cap 15% volatility, small-cap 30%+. Debt funds (1-2) yield 6-8% with 2-6% volatility. Hybrids (3) average 9-12% returns, 10-14% volatility.
Sharpe ratio measures return per risk unit – equity 0.7-0.9, debt 0.5-0.7 over complete cycles. Higher risk categories compensate through return premium capturing economic growth.
Volatility Metrics Explained
Standard Deviation: Annual NAV return dispersion—equity 18-22%, debt 4-6%.
Maximum Drawdown: Peak-to-trough losses – equity 50%+ (2008), debt 8-12%.
Beta: Market sensitivity – equity 0.9-1.1, debt 0.1-0.3.
Sortino Ratio focuses downside volatility—equity 1.0-1.3 favoring recoveries.
Value at Risk (VaR) estimates 95% confidence, worst 1-month loss: equity 10-15%, debt 1-2%.
Category Risk-Return Profiles
Large-cap equity: 12-14% CAGR, 15% volatility, Sharpe 0.8.
Mid/small-cap: 15-18%, 22-30% volatility, Sharpe 0.7.
Corporate bond debt: 7-8%, 4% volatility, Sharpe 0.6.
Liquid funds: 6.5%, <1% volatility—capital preservation.
Credit risk debt: 8.5%, 6% volatility—yield pickup.
Hybrids: 10-12%, 12% volatility—balanced exposure.
Review types of mutual funds specifications confirming mandated asset allocations driving profiles.
Historical Risk-Return Tradeoffs (2000-2025)
Complete cycles: Equity 14% CAGR/18% volatility; 60/40 equity/debt 11%/11% volatility; debt 7.5%/5% volatility. Bull phases (2013-2021): equity 18%, debt 8%. Bear markets (2008, 2020): equity -50%/+80% swings, debt -10%/+10%.
Inflation-adjusted: Equity 8% real CAGR; debt 1.5% real—growth funding requires equity allocation.
Risk Capacity Assessment Framework
Short-term goals (1-3 years): Riskometer 1-2 (liquid/debt), 2-4% real returns. Medium-term (5-7 years): Level 3 (hybrid), 4-6% real. Long-term (10+ years): Level 4-5 (equity), 6-9% real.
Personal factors: Age (younger = higher risk), income stability, emergency fund coverage, other assets. Drawdown tolerance—20% comfortable vs 40% discomfort signals capacity limits.
Portfolio Construction Principles
Diversification: 60/40 equity/debt reduces volatility 40% versus equity-only while capturing 80% returns.
Correlation: Equity/debt 0.3 average enables smoothing.
Rebalancing: Annual drift correction sells outperformers (equity +25%), buys underperformers (debt -5%).
Style balance: Large-cap stability offsets mid-cap growth volatility.
Quantitative Risk Management Tools
Sharpe Ratio: >1.0 indicates efficient risk-taking.
Information Ratio: Alpha per tracking error.
Downside Deviation: Focuses losses only.
Stress Testing: 2008 scenario simulations reveal portfolio behavior extremes.
Conclusion
Higher mutual fund risk levels correlate with elevated return potential – equity 12-16% amid 18-25% volatility versus debt 6-8%/4-6%. Risk capacity matching, category diversification, rebalancing discipline, and quantitative metric interpretation align portfolios with personal tolerance across economic cycles.
Disclaimer: Investments in the securities market are subject to market risk, read all related documents carefully before investing.


