Connect with us

MAM

Fox unveils sponsors for 11th season of ‘American Idol’

Published

on

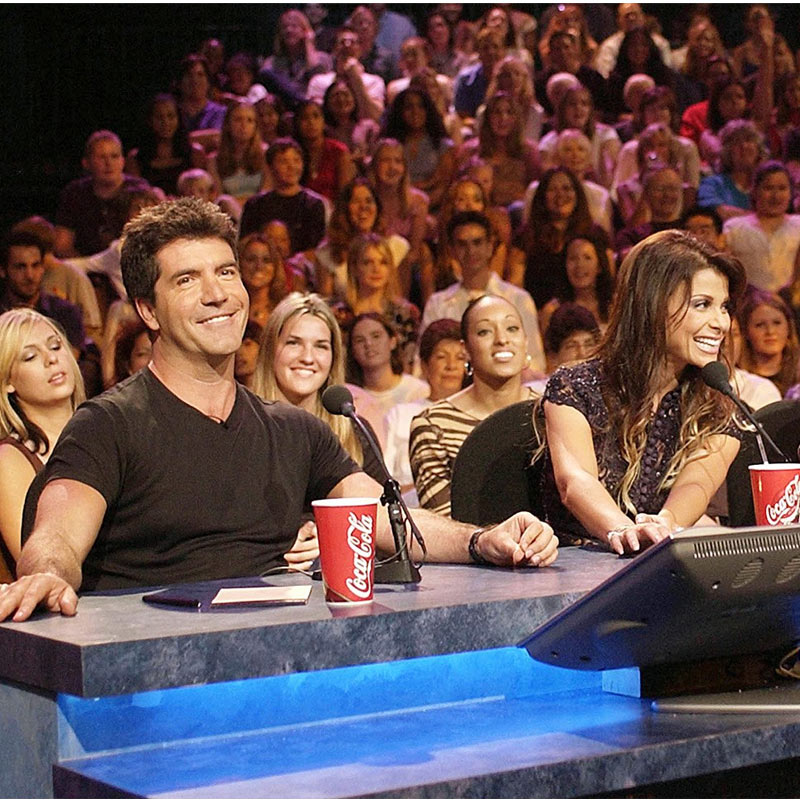
MUMBAI: US broadcaster Fox, 19 Entertainment and FremantleMedia have announced that Ford, Coca-Cola and AT&T will return as the official sponsors for the 11th season of the music-based reality show ‘American Idol‘.

As a leading partner since the show‘s debut in 2002, Ford has returned as the official automotive sponsor. Once again, Ford vehicles and the show‘s finalists will be featured each week in Ford music videos, airing Thursday nights. This content, along with candid ‘making of‘ segments featuring the contestants, will also be available on www.americanidol.com. In addition, Ford will launch an all-new online promotion, offering fans an exclusive chance to win the ultimate show experience.

The show will continue to serve as a platform for a variety of Ford vehicles, including the all-new 2013 Ford Escape. Ford will award a brand-new vehicle to both the runner-up and winner.

Advertisement

For the 11th season, Coca-Cola is offering programmes that bring “families together to enjoy moments of happiness and fun”. The show is the kickoff platform for the Coca-Cola Family Night program, which presents activities and recipes throughout January and February that encourage families to “make tonight a family night.” They will also launch the new “Coca-Cola Music Cover Artwork” contest. Fans can develop their own special music cover graphics at www.mycokerewards.com/family and they could win a trip to attend the live American Idol finale. Coming back for a second year is the popular Perfect Harmony program that provides teens and young adults the opportunity to write a song with an award winning artist.

This collaboration will culminate in an incredible performance on the biggest stage in Hollywood during an American Idol broadcast. In addition, Coca-Cola will share exclusive behind-the-scenes content online at www.mycokerewards.com and www.americanidol.com, providing fans with an inside look at the contestant experience. Other activities designed to enhance the ‘American Idol‘ experience will be featured in a variety of retail outlets across the country.

AT&T returns this year to celebrate its 10th anniversary as the official wireless sponsor of American Idol. Once again, AT&T makes voting easier and more convenient for its customers through exclusive unlimited text-voting during the voting window after each show. Additionally, AT&T customers will benefit from unique access to their favourite Idol moments through popular mobile phone content, including Vote Number Reminder, Social Sharing of Votes and Idol Trivia.

Advertisement
Click to comment

Leave a Reply

Your email address will not be published. Required fields are marked *

MAM

How Risk and Return Are Linked in Mutual Funds

Published

on

Risk and return maintain inverse proportionality within mutual funds – higher potential rewards accompany elevated volatility, while stability demands lower expectations. SEBI’s Riskometer (1-5 scale) standardizes visualization, but quantitative metrics reveal nuanced relationships across categories and market cycles.

Fundamental Risk-Return Relationship

Equity funds (Riskometer 4-5) deliver historical 12-16% CAGR alongside 18-25% standard deviation—large-cap 15% volatility, small-cap 30%+. Debt funds (1-2) yield 6-8% with 2-6% volatility. Hybrids (3) average 9-12% returns, 10-14% volatility.

Advertisement

Sharpe ratio measures return per risk unit – equity 0.7-0.9, debt 0.5-0.7 over complete cycles. Higher risk categories compensate through return premium capturing economic growth.

Volatility Metrics Explained

Standard Deviation: Annual NAV return dispersion—equity 18-22%, debt 4-6%. 

Advertisement

Maximum Drawdown: Peak-to-trough losses – equity 50%+ (2008), debt 8-12%. 

Beta: Market sensitivity – equity 0.9-1.1, debt 0.1-0.3.

Sortino Ratio focuses downside volatility—equity 1.0-1.3 favoring recoveries. 

Advertisement

Value at Risk (VaR) estimates 95% confidence, worst 1-month loss: equity 10-15%, debt 1-2%.

Category Risk-Return Profiles

Large-cap equity: 12-14% CAGR, 15% volatility, Sharpe 0.8. 

Advertisement

Mid/small-cap: 15-18%, 22-30% volatility, Sharpe 0.7. 

Corporate bond debt: 7-8%, 4% volatility, Sharpe 0.6.

Liquid funds: 6.5%, <1% volatility—capital preservation. 

Advertisement

Credit risk debt: 8.5%, 6% volatility—yield pickup. 

Hybrids: 10-12%, 12% volatility—balanced exposure.

Review types of mutual funds specifications confirming mandated asset allocations driving profiles.

Advertisement

Historical Risk-Return Tradeoffs (2000-2025)

Complete cycles: Equity 14% CAGR/18% volatility; 60/40 equity/debt 11%/11% volatility; debt 7.5%/5% volatility. Bull phases (2013-2021): equity 18%, debt 8%. Bear markets (2008, 2020): equity -50%/+80% swings, debt -10%/+10%.

Inflation-adjusted: Equity 8% real CAGR; debt 1.5% real—growth funding requires equity allocation.

Advertisement

Risk Capacity Assessment Framework

Short-term goals (1-3 years): Riskometer 1-2 (liquid/debt), 2-4% real returns. Medium-term (5-7 years): Level 3 (hybrid), 4-6% real. Long-term (10+ years): Level 4-5 (equity), 6-9% real.

Personal factors: Age (younger = higher risk), income stability, emergency fund coverage, other assets. Drawdown tolerance—20% comfortable vs 40% discomfort signals capacity limits.

Advertisement

Portfolio Construction Principles

Diversification: 60/40 equity/debt reduces volatility 40% versus equity-only while capturing 80% returns. 

Correlation: Equity/debt 0.3 average enables smoothing.

Advertisement

Rebalancing: Annual drift correction sells outperformers (equity +25%), buys underperformers (debt -5%). 

Style balance: Large-cap stability offsets mid-cap growth volatility.

Quantitative Risk Management Tools

Advertisement

Sharpe Ratio: >1.0 indicates efficient risk-taking. 

Information Ratio: Alpha per tracking error. 

Downside Deviation: Focuses losses only.

Advertisement

Stress Testing: 2008 scenario simulations reveal portfolio behavior extremes.

Conclusion

Higher mutual fund risk levels correlate with elevated return potential – equity 12-16% amid 18-25% volatility versus debt 6-8%/4-6%. Risk capacity matching, category diversification, rebalancing discipline, and quantitative metric interpretation align portfolios with personal tolerance across economic cycles.

Advertisement

Disclaimer: Investments in the securities market are subject to market risk, read all related documents carefully before investing.

Continue Reading

Advertisement News18
Advertisement
Advertisement Whtasapp
Advertisement Year Enders

Indian Television Dot Com Pvt Ltd

Signup for news and special offers!

Copyright © 2026 Indian Television Dot Com PVT LTD